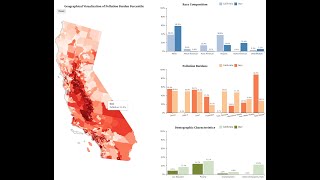
WooJung Kim
Geographical Visualization of Pollution Burden Percentile
5 months ago - 2:35

Jarren Santos
Geographical Visualization of Medicare Providers
9 years ago - 0:08
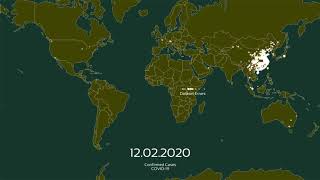
Cosmic Sound
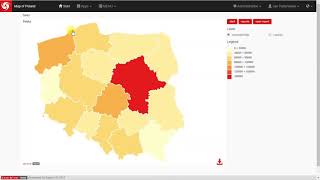
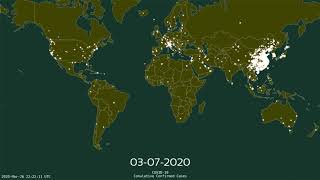
COVID-19 Geographical Visualization from 01-01-2020 to 22.03.2020
5 years ago - 1:57

The Geography Atlas
What Is An Interactive Map Data Visualization? - The Geography Atlas
3 months ago - 3:26
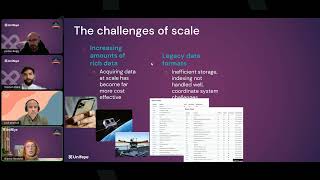
Unifeye-Databricks
Geospatial Data Engineering & Analytics On Databricks
2 months ago - 1:04:06
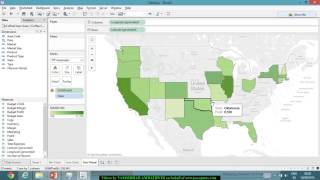
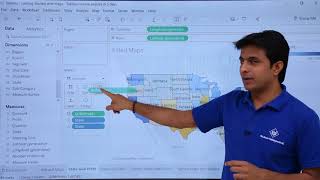
Tableaufans com
Tableau - How to transform street level information into a geographical visualization
9 years ago - 23:03

Jithesh Kuyyalil
Python - machine learning #3 - geographical visualization - coding for all
4 years ago - 5:48

GeoPoint Surveying, Inc.
GeoPoint Surveying, Inc. provides standard-setting survey services including subsurface utility location, remote sensing/LiDAR, ...
@geopointsurveying subscribers

Cosmic Sound
COVID-19 Geographical Visualization 25-03-2020
5 years ago - 1:40
Cosmic Sound
COVID-19 Geographical Visualization 26-03-2020
5 years ago - 1:38

Datalume
Power BI and Azure Maps: Power BI Finance Reporting Project | Part 5
1 year ago - 9:15

Checkmk
Checkmk Conference #11: From discovery to integration – Elevate your monitoring
6 months ago - 24:17
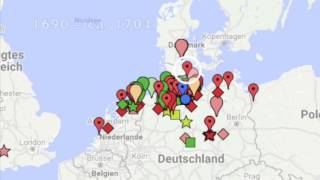
Ibo Ortgies
Arp Schnitger 1648–1719 – An Animated Visualization
6 years ago - 13:06

Ninja Fun Fact
How does geographical #visualization enhance managerial excellence? unlocking managerial #excellence
1 year ago - 0:51
Geo Story
“This circle contains most of humanity…” #geostory #geographythroughmaps #worldgeography #uk #usa
3 days ago - 1:29
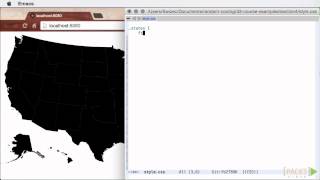
Packt
Mastering D3.js Tutorial: Drawing a Map | packtpub.com
10 years ago - 5:48
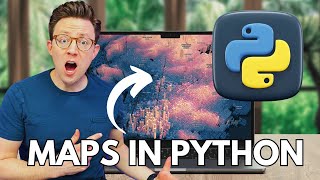
Matt Forrest
Visualize geographic data in Python!
1 year ago - 3:25
Epacta SI Poland - software developer
@MrEpacta subscribers

Data Science Discovery
Data Science DISCOVERY MicroProjects w/ Michelle - #07: "Chloropleth Maps"
9 months ago - 11:43

Test Taker
Exp19_Excel_Ch10_CapAssessment_Movie_Rentals | Excel Ch10 Movie Rentals | @myitlabsolutions161
1 year ago - 22:40
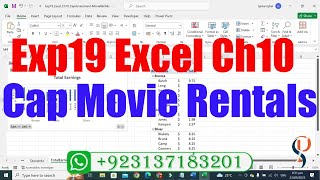
Pearson Solutions
Exp19_Excel_Ch10_CapAssessment_Movie_Rentals | Exp19 Excel Ch10 MovieRentals | @PearsonSolution
1 year ago - 36:58
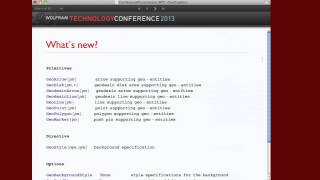
Wolfram
Geographic Visualization
11 years ago - 23:44
WooJung Kim
@WooJungKim-bow subscribers

Alex The Analyst
How to Create Visualizations in Tableau | Tableau Tutorials for Beginners
4 years ago - 14:05
JI networks
"Countries & Their Provinces/States – World Geography Overview"
1 day ago - 0:06

Alex The Analyst
Creating Visualizations using Pandas Library | Python Pandas Tutorials
2 years ago - 16:50

Rhythm Emotion
Wonderful Wilderness Landscapes | Relaxing Sounds to Relieve Stress and Fatigue | 4K 60 FPS
-
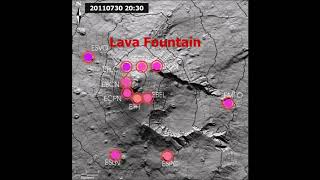
ScienceVio
Short-term detection of volcanic unrest at Mt. Etna by means of a multi-station warning system
6 years ago - 1:25
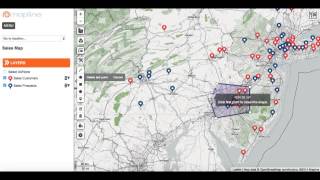
Mapline
How to Draw Custom Shapes On a Map and Identify Pins Inside a Territory Polygon
10 years ago - 0:34
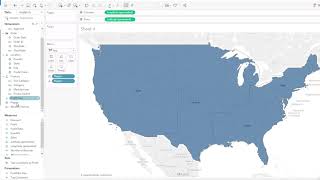
Jownology
Tableau Converting to Geographic Data Ep 2
3 years ago - 1:21

Chris Menard
Excel Chart Maps used with the Geography Data Type
3 years ago - 3:45

Jon Schwabish
B2VB Week#7: Building a Symbol Map of the Wonders of the World | Jon Schwabish
1 year ago - 8:45

CMSHHSgov
Insurance has you covered—body, mind, and spirit – Lakota
6 years ago - 0:31

Planet Snapshot
SHOCKING Geography Truths You Need To Know | Geography
15 hours ago - 0:22
Cosmic Sound
Hello, I'm a passionate creator. I create everywhere I go. I create music, art, and scientific content. If you like any of my work and ...
@cosmicsound6466 subscribers
Lovelytics
Mapping with Spatial Files - Tableau Walkthrough
7 years ago - 4:47
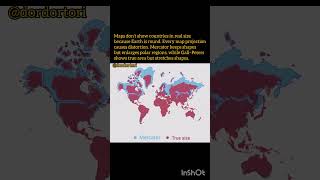
dordortori
The difference between the countries' actual areas and the map we use, #map #facts #world #geography
2 days ago - 0:06

Mapping with Harsh
India's length and width through map animation ⛰️ #geography #indiangeography #mapanimation
8 months ago - 0:22
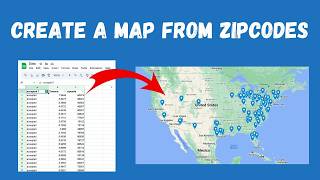
Nathan Vandermost
How to Create a Map from Zip Codes Using Google Sheets and Google Maps
1 year ago - 7:24
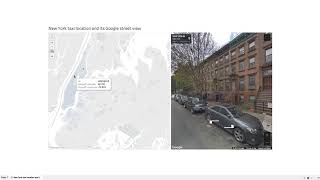
Kang Ke
Tableau and Google street view
7 years ago - 0:24

CloudFoundation
Tableau Hierarchy | Tableau Drill Downs | Tableau Maps | Tableau Tutorial | Tableau |CloudFoundation
7 months ago - 1:05:28

Scale Campaign
Find Latitude and Longitude from Address
8 years ago - 0:38
Pearson Solutions
Exp19_Excel_Ch10_CapAssessment_Movie_Rentals | 100% Chapter 10 Capstone Assessment Movie Rentals
1 year ago - 14:35

Acts2020 Project
Acts 13:15-41 - Paul's 1st Journey | Paul's Sermon & Justification in Pisidian Antioch
2 months ago - 11:36